Hanging on the wall of MAC 105 is a grid of faces from 20 years ago. Garish color outlines five prominent political figures such as Arnold Schwarzenegger and Condoleezza Rice, alongside three Palo Alto High School students.
None of us knew the full significance of that faded Verde cover until our adviser handed us the original copy of the magazine. Inside it, we discovered a comprehensive record of Paly students’ political views.
In 2004, Verde surveyed four social studies classes per grade to learn about the political opinions of the student body ahead of the November election, in which John Kerry and George W. Bush faced off. This year, we recreated that survey ahead of the March 5 primary elections.
On Feb. 4 we used paper ballots to anonymously survey 390 students — a little more than 20% of the student body — on questions ranging from abortion to immigration to the presidential election. With some exceptions, we used language similar to the 2004 survey. Because of the large sample size, the margin of error for this survey was less than 5%.
We recognize that because the 2004 survey was conducted closer to a major election rather than a primary, student political opinions may have been more fully formed at the time.
The Paly-tical spectrum

Generally, Palo Alto is seen as a highly liberal and Democratic place.
Highly educated adults are more likely to hold liberal views, according to the Pew Research Center, and the most recent U.S. Census stated that 82.2% of Palo Alto’s adult population has earned a bachelor’s degree or higher. And in 2020, 72.64% of Santa Clara County voters chose Joe Biden over Donald Trump, according to the County Registrar’s Office.
But how liberal are Paly students, in reality?
When asked to rate themselves on a 1 to 5 scale from strongly liberal to strongly conservative, 50.4% of students rated themselves strongly or moderately liberal (1 or 2), whereas 13% of students rated themselves strongly or moderately conservative (5 or 4).
Additionally, 36.5% of students rated themselves in the middle (3). The average rating was 2.54 (1 being strongly liberal and 5 being strongly conservative), which shows that Paly’s student body is liberal-leaning.
The percentage of strongly or moderately liberal students decreased from 59% in 2004, and the share of students in the middle of the spectrum increased from 27% to 36.5%. The percentage of strongly or moderately conservative students stayed about the same.
At a time when the Pew Research Center reported that Republicans and Democrats are becoming more polarized, Paly’s share of politically moderate students shows that, locally, not everyone is moving further away from the center.
Gender gaps
According to national Gallup polls over the decades, young women are becoming more liberal, whereas the political views of young men are mostly staying stable. This has contributed to a gender divide over crucial political and cultural issues, some analysts have asserted.
When tallying up the results of Verde’s survey, we found a gender difference on certain issues, which may align with this trend. (The 2004 survey did not sort results by gender, so we cannot compare the views of male or female respondents from 20 years ago.)
Only 5% of respondents placed themselves in a category other than male or female; because of the small sample size of this group, we did not have enough data to draw a conclusion about their views.
When asked to rate themselves from 1 (strongly pro-choice) to 5 (strongly pro-life), 55% of students rated themselves as strongly pro-choice. According to the Pew Research Center, national views on abortion have remained relatively stable over the past two decades, which aligns with the 2004 data.
In the 2004 survey, 50% of respondents rated themselves as pro-choice — just a 5% difference from today, despite massive changes in the reproductive rights landscape across the U.S. since the overturning of Roe v. Wade in 2022.
At Paly, only 5.1% of respondents today, compared to 12.5% of respondents 20 years ago, rated themselves as strongly pro-life.
Looking at the data by gender, 72.2% of the female respondents rated themselves as strongly pro-choice compared with just 36.4% of male respondents. Only 2.4% of females rated themselves as strongly pro-life compared with 8.2% of males. This reveals that while Paly as a school leans pro-choice, female students are significantly more pro-choice than males.
A similar divide appeared in the data around support for the LGBTQ+ community. On a 1 to 5 scale across all genders, 49.9% of Paly respondents in 2024 rated themselves as strongly supportive of the LGBTQ+ community. Only 5.7% of students rated themselves as strongly unsupportive.
By gender, 67.6% of females rated themselves as strongly supportive compared with just 29.7% of males and 24.6% of males rated themselves as strongly or moderately unsupportive of
the LGBTQ+ community, compared to just 4.5% of females.


Candidate choices
Although most students are not old enough to vote, we were curious if their choice of candidate would match the most recent national polls of Joe Biden and Donald Trump being in a close contest for president.
Assuming the presidential election would be between Donald Trump and Joe Biden, and if all students were old enough to vote, 51.8% of respondents

reported that they would vote for Biden, compared with 8.6% of students who would vote for Trump. Additionally, 18.6% of students rated themselves as unsure of who they would vote for, and 16% said they would choose not to vote at all.
There was a significant gender disparity in presidential voting: 38.6% of male respondents would be Biden voters compared with 65% of female respondents, and 12.2% of male respondents would vote for Trump compared with 5.6% of female respondents.
The majority of students (69.6%) were unsure of who they would vote for in the upcoming District 16 congressional election. Of the six named frontrunners, Julie Lythcott-Haims received the most votes (24), at 6.6% of the total.
The percentage of unsure respondents was even higher for the Senate race — 78.6%. Of the four named candidates, Adam Schiff and Barbara Lee tied at 10 votes each, with Katie Porter a close second at 9 votes.
Males were more likely (18.3%) to report that they would not vote, compared to females (4.7%). By contrast, more females (88.8%) than males (68%) said they were unsure of who they would vote for.
Modern media
When looking at the 2004 data for the media students used to follow campaigns, most of us didn’t know the difference between network and cable TV. But 20 years ago, both were the media of choice for survey respondents (68% for cable TV and 45% for network TV). Students could check more than one medium on the survey.
In 2024, those numbers decreased: 38.5% of students followed political campaigns through any type of TV network. And 12.3% of them listened to campaign news on the radio, compared to 20% in 2004.
The percentage of students who followed campaigns through print publications also decreased. In 2004, almost half of the students read newspapers and 24% read newsmagazines; in 2024, only 11% of respondents followed political campaigns through any type of print publication.
By far, digital media has overtaken these alternative forms. In 2004, 35% of respondents said they used the Internet (or “the Net,” per a Paly government teacher) to follow political campaigns. Now, 59.2% of students use online news publications and 62.3% use social media, which didn’t exist in 2004. Other sources mentioned by students included YouTube, podcasts and church.
Over 66% of current students said that friends and family members were a resource they used to follow political campaigns, which was the most-checked category. (Family and friends was not a listed category on the 2004 survey.)
 International issues
Foreign policy issues are looming large in both the March 5 primary and the November general election.
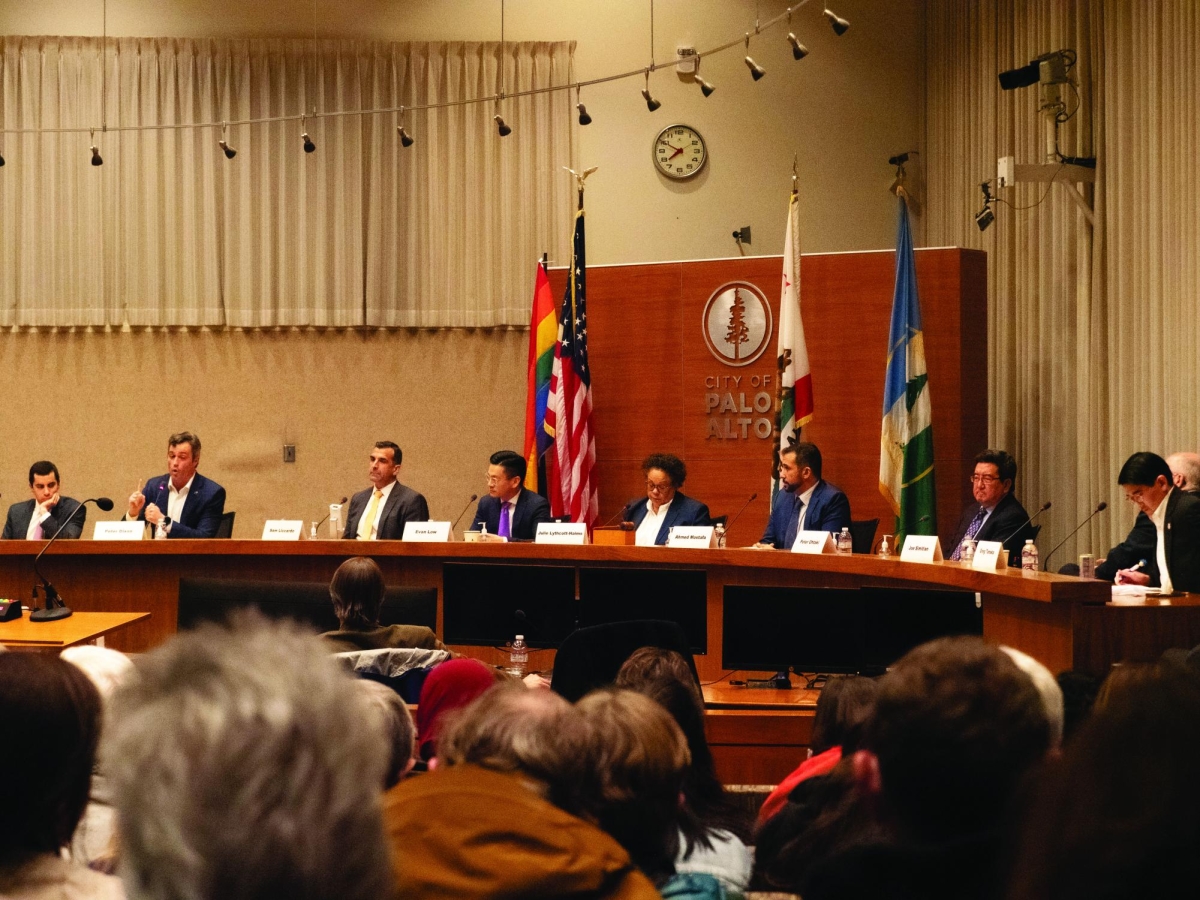
One of the issues of interest is the Israel-Hamas conflict, the subject of a recent protest at Palo Alto City Hall. When asked to rate President Biden’s handling of the Israel-Hamas war on a 1 (strongly approve) to 5 (strongly disapprove) scale, the majority of respondents, 59.1%, rated themselves as in the middle (3). Just 9% said they strongly approved (1) while 30.1% said they strongly or moderately disapproved (4 or 5).
This is more favorable of Biden than national data as of Dec. 8, where, according to a Pew Research Center survey, 41% of U.S. adults disapprove of Biden’s response to the conflict.
Funding for Ukraine has also been a contentious national issue, especially within the Republican party. In the survey, 24.1% of respondents said they strongly supported Ukraine funding, 33.1% were moderately supportive, and 28% were in the middle.
These local student results are in line with national polling on this issue, where 31% of the country believes too much aid is being given to Ukraine, according to a Dec. 8 poll from the Pew Research Center.
In addition, border security has been a politically volatile issue. We asked respondents to rate their opinion of President Biden’s handling of immigration on a 1 (strongly approve) to 5 (strongly disapprove) scale.
 Significantly, this question was the least-answered one on the survey. We wondered if it was because students didn’t feel like they knew enough about the topic to answer, or didn’t have strong opinions. Of the 303 (out of 390) students who responded, 61.5% rated themselves as in the middle (3). Nationally, among those who disapprove of Biden, 19% of them blamed immigration as the biggest reason, according to a Gallup poll.
Takeaways
Although 89.8% of survey respondents were not yet eligible to vote, we still believe that learning students’ political opinions is valuable. In the near future, all students will have the chance to participate in the democratic process.
But learning about the views of the student body is not just important in a political sense; it also provides insight into who we are as a school. We’re tempted to wonder: What will have changed in 2044?